De-Obfuscating the Statistics of Mass Shootings
July 5, 2015
Roscoe, N.Y.
After the horrifying killings at the Mother Emanuel African Methodist Episcopal Church in Charleston, South Carolina, President Obama once more had to speak publicly about a mass shooting. "Let’s be clear," he said. "At some point, we as a country will have to reckon with the fact that this type of mass violence does not happen in other advanced countries. It doesn’t happen in other places with this kind of frequency."
Of course, those people whose function in life is to contradict everything this President says or does were quick to note that other countries do have mass shootings. Some right-wing web sites even went a step further by posting statistics that seem to suggest that when mass shootings are corrected for population, the United States doesn't come out too bad. One such article on IJReview.com included the following chart:
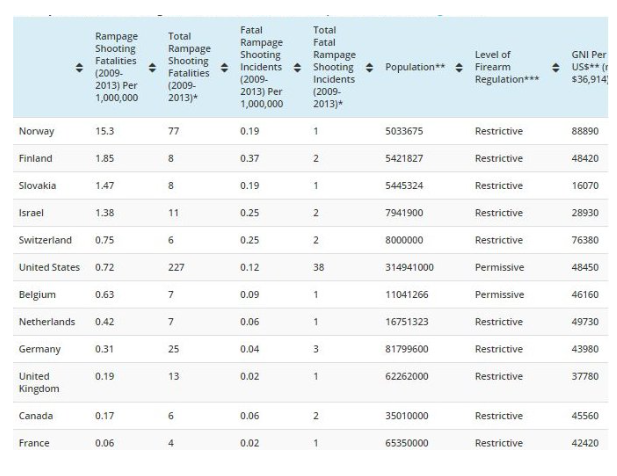
The web site triumphantly exclaimed "Boom, here we go."
The table shows data of 12 of the 34 countries that comprise the Organisation for Economic Co-operation and Development (OECD). These countries are generally considered to be examples of "industrialized" or "advanced" countries and can legitimately be compared.
The first four columns of the table show (not in this order) the number of rampage shootings in these 12 countries during the five-year period from 2009 through 2013; the number of fatalities of the shootings; and the per-capita rates per million of population. Regardless whether you look at the number of shooting incidents or the number of fatalities, the United States ranks 6th after Norway, Finland, Slovakia, Israel, and Switzerland.
IJReview.com obtained its numbers from a defunct web site called www.RampageShooting.com, but an archived page is available that lists the other 22 countries of the OECD and their populations. (Six additional countries had one rampage shooting each during this five-year period but were not listed in the IJReview summary.) The RampageShooting.com site even highlights the five countries with higher rates than the U.S. with graphics that form guns out of the countries' flags:

Do you see American flag here? The graphic emphasizes that the United States has lower rates of mass shootings than these five countries. In this analysis, we're not number one.
I’m not going to argue with the validity of the data themselves. I’m going to assume that all the numbers are all correct. But I am going to question the validity of ranking countries in this way and drawing conclusions from that ranking.
For this analysis, I’ll focus exclusively on the number of incidents of mass shootings, and not the number of people killed in these mass shootings. The second figure seems to me to involve a second variable, which relates to the average number of people killed in such shootings.
Here is my table that reproduces the countries that experienced mass shootings, ordered by rate of mass shootings per million of population:
| Country | Rampage Shootings | Population | Shootings Per Million |
|---|---|---|---|
| Finland | 2 | 5,421,827 | 0.369 |
| Israel | 2 | 7,941,900 | 0.252 |
| Switzerland | 2 | 8,000,000 | 0.250 |
| Norway | 1 | 5,033,675 | 0.199 |
| Slovakia | 1 | 5,445,325 | 0.184 |
| United States | 38 | 314,941,000 | 0.121 |
| Hungary | 1 | 9,942,000 | 0.101 |
| Greece | 1 | 10,787,690 | 0.093 |
| Belgium | 1 | 11,041,266 | 0.091 |
| Netherlands | 1 | 16,751,323 | 0.060 |
| Canada | 2 | 35,010,000 | 0.057 |
| Germany | 3 | 81,799,600 | 0.037 |
| Spain | 1 | 47,190,493 | 0.021 |
| Italy | 1 | 60,813,326 | 0.016 |
| United Kingdom | 1 | 62,262,000 | 0.016 |
| France | 1 | 65,350,000 | 0.015 |
| Mexico | 1 | 113,910,608 | 0.009 |
| Japan | 1 | 126,659,683 | 0.008 |
Here's a second version of the same table including the other countries that comprise the OECD. These countries are again sorted by rate of mass shootings per million of population, and then by population:
| Country | Rampage Shootings | Population | Shootings Per Million |
|---|---|---|---|
| Finland | 2 | 5,421,827 | 0.369 |
| Israel | 2 | 7,941,900 | 0.252 |
| Switzerland | 2 | 8,000,000 | 0.250 |
| Norway | 1 | 5,033,675 | 0.199 |
| Slovakia | 1 | 5,445,325 | 0.184 |
| United States | 38 | 314,941,000 | 0.121 |
| Hungary | 1 | 9,942,000 | 0.101 |
| Greece | 1 | 10,787,690 | 0.093 |
| Belgium | 1 | 11,041,266 | 0.091 |
| Netherlands | 1 | 16,751,323 | 0.060 |
| Canada | 2 | 35,010,000 | 0.057 |
| Germany | 3 | 81,799,600 | 0.037 |
| Spain | 1 | 47,190,493 | 0.021 |
| Italy | 1 | 60,813,326 | 0.016 |
| United Kingdom | 1 | 62,262,000 | 0.016 |
| France | 1 | 65,350,000 | 0.015 |
| Mexico | 1 | 113,910,608 | 0.009 |
| Japan | 1 | 126,659,683 | 0.008 |
| Turkey | 0 | 74,724,269 | 0.000 |
| South Korea | 0 | 50,004,441 | 0.000 |
| Poland | 0 | 38,186,860 | 0.000 |
| Australia | 0 | 22,841,921 | 0.000 |
| Chile | 0 | 16,572,475 | 0.000 |
| Portugal | 0 | 10,581,949 | 0.000 |
| Czech Republic | 0 | 10,512,208 | 0.000 |
| Sweden | 0 | 9,540,065 | 0.000 |
| Austria | 0 | 8,414,638 | 0.000 |
| Ireland | 0 | 6,399,152 | 0.000 |
| Denmark | 0 | 5,580,413 | 0.000 |
| New Zealand | 0 | 4,445,436 | 0.000 |
| Slovenia | 0 | 2,055,496 | 0.000 |
| Estonia | 0 | 1,340,194 | 0.000 |
| Luxembourg | 0 | 524,853 | 0.000 |
| Iceland | 0 | 320,060 | 0.000 |
| Total | 61 | 1,250,346,146 | 0.049 |
| Total Non-US | 23 | 935,405,146 | 0.025 |
This table, however, includes two summary lines at the bottom that neither the RampageShooting.com nor IJReview.com bothered with. These are totals with and without the United States. Perhaps there was a reason why these obviously important totals were excluded.
Just to reiterate: These are the 34 countries that comprise the OECD, with the population and number of mass shootings from the years 2009 through 2013 taken directly from the RampageShooting.com web site. This is all the information that I'll be analyzing.
Statistical Significance
The primary purpose of statistics is to help us understand various phenomena of the real world and possibly to predict what might happen in the future. How meaningful is the fact that Finland tops the chart with a rate of 0.369 mass shootings per million of population over a five-year period? Does it tell us anything significant about Finland? Does it mean that Finland is the mass shooting capitol of the world? How could it, with only two mass-shooting incidences in five years? Does it mean that Finland will continue to have two mass shootings every five years? Not necessarily. The numbers are too small to tell us anything.
Tiny numbers do not make good statistics. Yet, all the countries in this table (except one) experienced just three mass shootings or fewer. These are very tiny numbers and their statistical significance is pretty much negligible.
What's additionally interesting is that the top five countries in this table all have populations under 10 million:
| Country | Rampage Shootings | Population | Shootings Per Million |
|---|---|---|---|
| Finland | 2 | 5,421,827 | 0.369 |
| Israel | 2 | 7,941,900 | 0.252 |
| Switzerland | 2 | 8,000,000 | 0.250 |
| Norway | 1 | 5,033,675 | 0.199 |
| Slovakia | 1 | 5,445,325 | 0.184 |
Only seven of the other countries in the OECD have populations less than 8 million. Keep in mind that the lower the population, the higher the per-capita rate. So we're dealing here not only with tiny numbers of incidents — because mass killings are not overall very common — but also small populations.
There is a phenomenon in statistics called "regression towards the mean." As you examine larger and larger populations, they tend to gravitate towards the average. Smaller populations are statistically more erratic and unstable because they more susceptible to random fluctuations. For a small country, 1 or 2 additional mass shootings in a five-year period can propel it to the top of the list.
Suppose we were to plot a graph with a horizontal axis based on ranges of rates of mass shootings. For each range of rates, the graph shows the total population of the countries that fit into that range. What should we expect?
We would expect the larger countries to cluster towards the range of tiny rates of mass shootings. By contrast, the smaller countries are the outliers where 1 or 2 mass shootings affect the rate a great deal. These smaller countries should be further from the average and tend more towards extremes, but with small heights in the graph because the populations are so small. In other words, we should expect a graph like this with a long but miniscule tail:
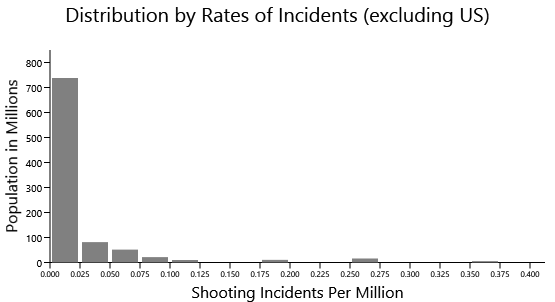
The four tiny bumps to the right of 0.100 are the five countries with the highest rates of mass shootings.
But the problem with that table is that it doesn't include the United States. Let's add the United States to the table:
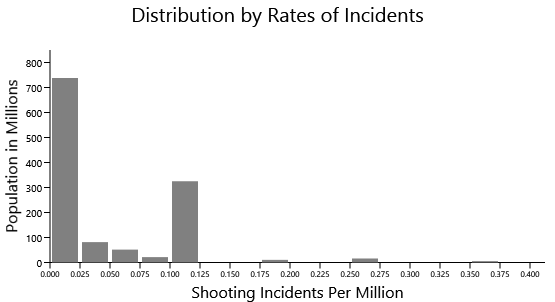
And now we see a bar in this graph with much more statistical significance because the population is very large, but which at the same time is also quite removed from the average established by the other OECD countries.
While it's interesting to examine comparisons of mass-shooting incidents in various countries, it is statistically invalid to compare these countries based on rankings that result from 1 or 2 or 3 mass shootings in the five-year period. When medical statistics are compiled, populations with less than a certain number of incidents of a particular disease or injury are considered to be unreliable. Here's a web page from the New York Department of Health that answers the question "Why are rates based on fewer than 20 cases marked as being unreliable?" The conclusion is that "When the rates are based on only a few cases or deaths, it is almost impossible to distinguish random fluctuation from true changes in the underlying risk of disease or injury."
Most of the countries in the tables posted by RampageShooting.com and IJReview.com have far lower than 20 incidents of mass shootings. Claiming that these data have statistical validity is either deliberately deceitful or ignorantly deceptive.
In the entire table of mass shooting statistics, only three lines meet any type of criteria for being statistically meaningful. Here they are:
| Country | Rampage Shootings | Population | Shootings Per Million |
|---|---|---|---|
| United States | 38 | 314,941,000 | 0.121 |
| All Other Countries | 23 | 935,405,146 | 0.025 |
| Total | 61 | 1,250,346,146 | 0.049 |
If you want a quick takeaway, the United States has a population that is one-quarter of the total population of the OECD countries, but accounts for more than half of the mass-shooting incidents. That is the truest statement that can be deduced from these data.
Nevertheless, let's continue the analysis to understand why a tiny number of incidents is usually treated as statistically insignificant.
A Computer Simulation
This talk about statistical stability and fluctuation of course prompts us to wonder if any of these data are valid. Let's explore this a bit by doing a few computer simulations. Here is an image showing the relative populations of the 34 OECD countries arranged alphabetically from left to right:

During the five-year period from 2009 through 2013 there occurred 61 incidents of mass shootings. Let us randomly distribute those 61 shootings throughout these countries. The implicit assumption is that the rate of mass shooting for each country is the same as the overall actual rate. Each shooting incident is symbolized as a black vertical bar:
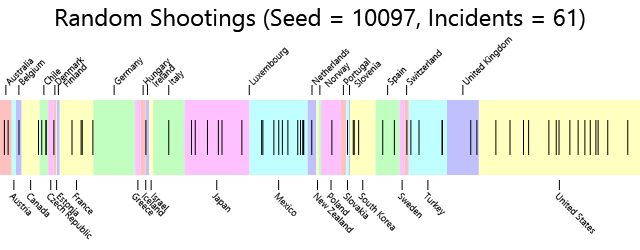
Now let's put the results in a table, ordered by the rate of shootings per million:
| Country | Rampage Shootings | Population | Shootings Per Million |
|---|---|---|---|
| Slovakia | 1 | 5,445,325 | 0.184 |
| Chile | 3 | 16,572,475 | 0.181 |
| Denmark | 1 | 5,580,413 | 0.179 |
| Ireland | 1 | 6,399,152 | 0.156 |
| Switzerland | 1 | 8,000,000 | 0.125 |
| Mexico | 11 | 113,910,608 | 0.097 |
| Belgium | 1 | 11,041,266 | 0.091 |
| Australia | 2 | 22,841,921 | 0.088 |
| France | 4 | 65,350,000 | 0.061 |
| South Korea | 3 | 50,004,441 | 0.060 |
| Netherlands | 1 | 16,751,323 | 0.060 |
| Turkey | 4 | 74,724,269 | 0.054 |
| United States | 15 | 314,941,000 | 0.048 |
| Japan | 6 | 126,659,683 | 0.047 |
| Spain | 2 | 47,190,493 | 0.042 |
| United Kingdom | 2 | 62,262,000 | 0.032 |
| Canada | 1 | 35,010,000 | 0.029 |
| Poland | 1 | 38,186,860 | 0.026 |
| Italy | 1 | 60,813,326 | 0.016 |
| Total | 61 | 1,250,346,146 | 0.049 |
| Total Non-US | 46 | 935,405,146 | 0.049 |
This table doesn't look much like the table of the actual numbers. Many more countries have mass shootings, and some of them have quite a few. While the United States still has more than anyone else — it is after all, the largest country here — the rate of mass shootings isn't nearly has high as the actual figure of 0.121.
Since these data were generated from a pseudo-random sequence of numbers that began with a "seed" number indicated in the heading, maybe a different seed will produce different results. Let's try another:
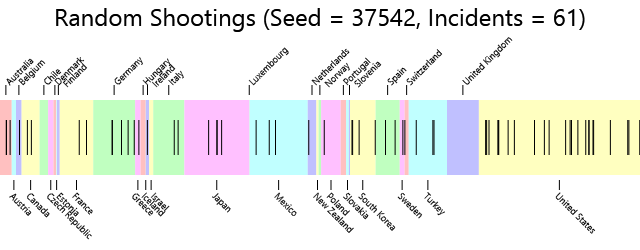
Here's the table with the results:
| Country | Rampage Shootings | Population | Shootings Per Million |
|---|---|---|---|
| Ireland | 1 | 6,399,152 | 0.156 |
| Australia | 3 | 22,841,921 | 0.131 |
| Switzerland | 1 | 8,000,000 | 0.125 |
| Sweden | 1 | 9,540,065 | 0.105 |
| Greece | 1 | 10,787,690 | 0.093 |
| Belgium | 1 | 11,041,266 | 0.091 |
| South Korea | 4 | 50,004,441 | 0.080 |
| United States | 24 | 314,941,000 | 0.076 |
| Germany | 5 | 81,799,600 | 0.061 |
| Netherlands | 1 | 16,751,323 | 0.060 |
| Canada | 2 | 35,010,000 | 0.057 |
| Spain | 2 | 47,190,493 | 0.042 |
| Turkey | 3 | 74,724,269 | 0.040 |
| Italy | 2 | 60,813,326 | 0.033 |
| Japan | 4 | 126,659,683 | 0.032 |
| France | 2 | 65,350,000 | 0.031 |
| Mexico | 3 | 113,910,608 | 0.026 |
| Poland | 1 | 38,186,860 | 0.026 |
| Total | 61 | 1,250,346,146 | 0.049 |
| Total Non-US | 37 | 935,405,146 | 0.040 |
This demonstrates that simple random fluctuation can produce very different results when not very many incidents are involved. Now the United States has a rate of shootings per million that is 50% higher than the average (but still not as high as its actual value). Let's try it again:
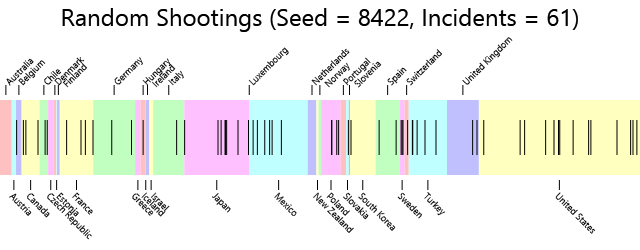
And here's the table:
| Country | Rampage Shootings | Population | Shootings Per Million |
|---|---|---|---|
| Sweden | 3 | 9,540,065 | 0.314 |
| Slovakia | 1 | 5,445,325 | 0.184 |
| Switzerland | 1 | 8,000,000 | 0.125 |
| Chile | 2 | 16,572,475 | 0.121 |
| Poland | 4 | 38,186,860 | 0.105 |
| Hungary | 1 | 9,942,000 | 0.101 |
| Belgium | 1 | 11,041,266 | 0.091 |
| Canada | 3 | 35,010,000 | 0.086 |
| Turkey | 5 | 74,724,269 | 0.067 |
| Japan | 8 | 126,659,683 | 0.063 |
| France | 4 | 65,350,000 | 0.061 |
| Mexico | 6 | 113,910,608 | 0.053 |
| United States | 14 | 314,941,000 | 0.044 |
| Spain | 2 | 47,190,493 | 0.042 |
| United Kingdom | 2 | 62,262,000 | 0.032 |
| Germany | 2 | 81,799,600 | 0.024 |
| South Korea | 1 | 50,004,441 | 0.020 |
| Italy | 1 | 60,813,326 | 0.016 |
| Total | 61 | 1,250,346,146 | 0.049 |
| Total Non-US | 47 | 935,405,146 | 0.050 |
And now the U.S. is lower than the average. That's the way randomness works. You really can't anticipate what can happen. But these irregularities are accentuated when small numbers are involved.
But where are these random "seeds" coming from? Am I making them up or experimenting with different values to see which ones will tell a particular story?
Not at all. The seeds that I'm using are from the first several entries in the famous book A Million Random Digits with 100,000 Normal Deviates. I'm using these seeds to generate random numbers and draw the results in a WPF program that you can download and experiment with yourself.
If we keep trying different random distributions of 61 mass shootings, will we ever find a case where 38 of the shootings are in the United States? Perhaps. But it should be clear by this time that the incidence of mass shootings in the United States is intrinsically different from the other OECD countries taken in aggregate.
One approach to see the difference is to artifically inflate the population of the United States by a factor of 4 and then distribute the 61 mass shootings among this artificial population. Because the United States is now 4 times its normal size (and larger than all the other countries combined) it gets more of the random shootings:
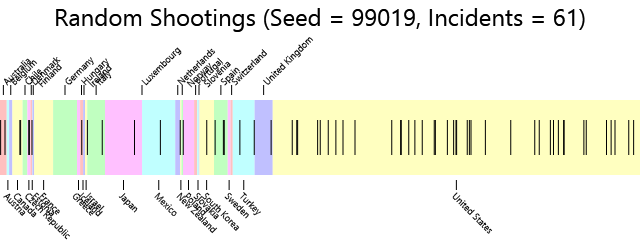
And here's the table summarizing the results:
| Country | Rampage Shootings | Population | Shootings Per Million |
|---|---|---|---|
| New Zealand | 1 | 4,445,436 | 0.225 |
| Czech Republic | 2 | 10,512,208 | 0.190 |
| Denmark | 1 | 5,580,413 | 0.179 |
| Hungary | 1 | 9,942,000 | 0.101 |
| Australia | 2 | 22,841,921 | 0.088 |
| Spain | 3 | 47,190,493 | 0.064 |
| Canada | 2 | 35,010,000 | 0.057 |
| Italy | 2 | 60,813,326 | 0.033 |
| United States | 40 | 1,259,764,000 | 0.032 |
| Turkey | 2 | 74,724,269 | 0.027 |
| Poland | 1 | 38,186,860 | 0.026 |
| South Korea | 1 | 50,004,441 | 0.020 |
| United Kingdom | 1 | 62,262,000 | 0.016 |
| Mexico | 1 | 113,910,608 | 0.009 |
| Japan | 1 | 126,659,683 | 0.008 |
| Total | 61 | 2,195,169,146 | 0.028 |
| Total Non-US | 21 | 935,405,146 | 0.022 |
This table looks a lot like the one with the real data. The other countries in the table all have incidences of 1, 2, or 3 mass shootings while the United States has 40 mass shootings. The actual figure is 38.
Let's try another random number seed:

And here's the table summarizing the results:
| Country | Rampage Shootings | Population | Shootings Per Million |
|---|---|---|---|
| Slovakia | 1 | 5,445,325 | 0.184 |
| Greece | 1 | 10,787,690 | 0.093 |
| Australia | 2 | 22,841,921 | 0.088 |
| South Korea | 3 | 50,004,441 | 0.060 |
| Turkey | 4 | 74,724,269 | 0.054 |
| Mexico | 4 | 113,910,608 | 0.035 |
| United Kingdom | 2 | 62,262,000 | 0.032 |
| Japan | 4 | 126,659,683 | 0.032 |
| France | 2 | 65,350,000 | 0.031 |
| United States | 33 | 1,259,764,000 | 0.026 |
| Poland | 1 | 38,186,860 | 0.026 |
| Germany | 2 | 81,799,600 | 0.024 |
| Spain | 1 | 47,190,493 | 0.021 |
| Italy | 1 | 60,813,326 | 0.016 |
| Total | 61 | 2,195,169,146 | 0.028 |
| Total Non-US | 28 | 935,405,146 | 0.030 |
Now there are a few countries with 4 mass shooting incidences and the United States is down to 33. Shall we try one more? Here goes:

And here's the table summarizing the results:
| Country | Rampage Shootings | Population | Shootings Per Million |
|---|---|---|---|
| Sweden | 2 | 9,540,065 | 0.210 |
| Turkey | 5 | 74,724,269 | 0.067 |
| United Kingdom | 4 | 62,262,000 | 0.064 |
| Poland | 2 | 38,186,860 | 0.052 |
| Spain | 2 | 47,190,493 | 0.042 |
| Germany | 3 | 81,799,600 | 0.037 |
| Mexico | 4 | 113,910,608 | 0.035 |
| France | 2 | 65,350,000 | 0.031 |
| United States | 33 | 1,259,764,000 | 0.026 |
| Japan | 3 | 126,659,683 | 0.024 |
| Italy | 1 | 60,813,326 | 0.016 |
| Total | 61 | 2,195,169,146 | 0.028 |
| Total Non-US | 28 | 935,405,146 | 0.030 |
Again, 33 in the United States.
But we are now generating tables of random mass shootings that generally resemble the table of actual mass shootings.
In other words, mass shootings among the OECD countries seems to resemble a random distribution but only if the United States is assumed to have a population that is four times its actual size.
Probability Distributions
Let's come at this analysis from another direction. If we know the probability of a particular event, we can also calculate the probability that a population of a certain size will experience a specific number of those events.
For example, consider a six-sided die. Toss it ten times. What is the probability that it will land 4 every time in these ten tosses? The probability of landing 4 just once is 1/6, so the probability of ten tosses in a row landing 4 is (1/6)10.
If you toss a die ten times, what is the probability of it landing on 4 only once, and something else the other nine times? The probability of it landing on 4 is 1/6, and the probability of it landing on something other than 4 is 5/6. For that to happen nine time is (5/6)9. However, there are ten ways this can happen. The first toss can land on 4, or the second, or the third etc, so the complete probability is 10 × (1/6) × (5/6)9. For the probability of two 4's coming up in ten tosses of a die, you have to figure out the combinations of how many ways that can happen, which is 45, so the probability is 45 × (1/6)2 × (5/6)8.
In general, for n trials where the probability of a "success" is p the probability of k successes is given by the binomial probability formula:

Let's assume that the probability of a mass shooting over a five-year period is the overall OECD average of 0.049 per million of population. The probability is actually 0.000000049 per person. That's the value p. What is the probability of 1 mass shooting in a population of 10,000,000, which is roughly characteristic of countries like Switzerland and Sweden? The variable n is 10,000,000 and the value r is 1. We can actually calculate the probabilities of 0 mass shootings, 1 mass shooting, 2, and so forth, and put them in a graph:
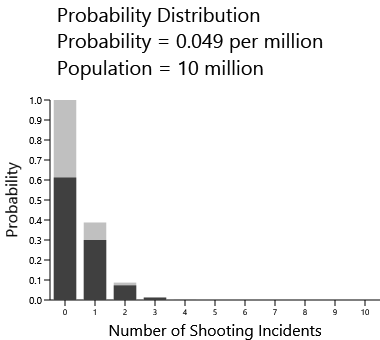
The dark bars show the probabilities. The probability of there being no shootings is a bit over 60% while the probability of there being just one shooting is a bit less than 30%. The gray bars show the accumulated probability, which is often useful. The probability of there being 0 or more shootings is obviously 1 or 100%, while the probability of there being 1 or more shootings is close to 40%.
Here's a similar graph for a population of 25,000,000, which is (very roughly) the population of Australia:
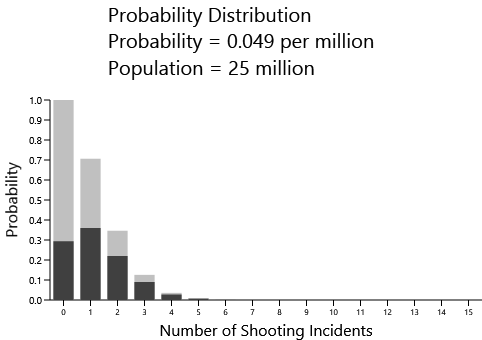
Now the most likely outcome is one mass shooting in a five-year period. Here's the distribution for a population of 50,000,000, such as Italy, Spain, France, the UK, and South Korea:
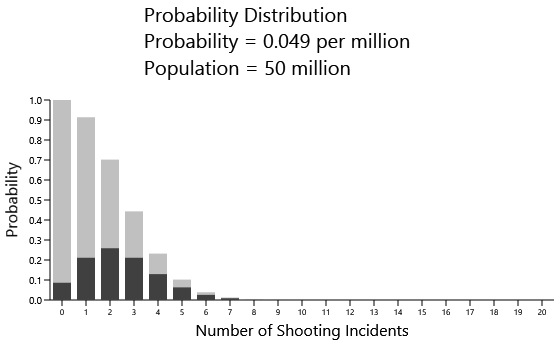
You can pretty much anticipate which will be the highest bar by just multiplying the probability of 0.049 times the population. For this example it's about 2.5, which is the highest likelihood of the expected number of mass shootings.
Here's a population of 100,000,000, which is about the size of Mexico and Japan:
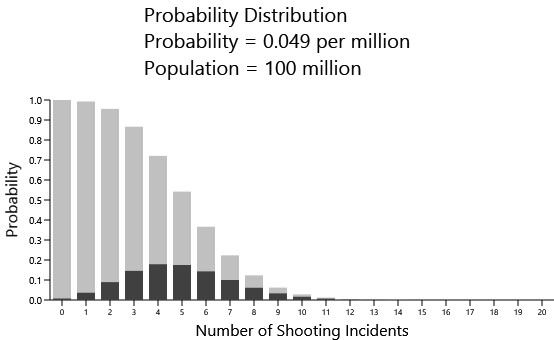
Now we're seeing a likelihood that is closer to 4 or 5 mass shootings. In reality, both Mexico and Japan had just one mass shooting in the five-year period. Why the big difference?
The probability of 0.049 per million that is being used for these graphs is the overall rate of mass shootings for the OECD countries, and that number is distorted by the high rate of mass shooting in the United States. For the non-US countries, the rate is actually 0.025. Let's try that with a population of 100,000,000:
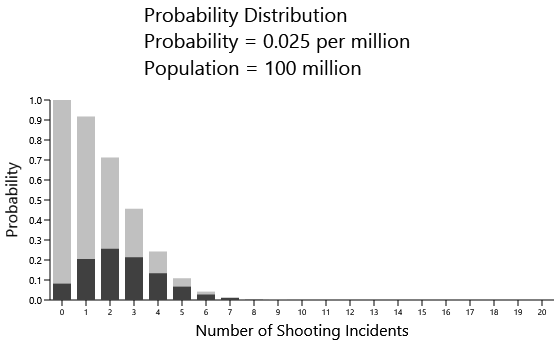
And now we get something much closer to reality.
Finally, let's jump up to a population of 300,000,000, which applies to the United States. Here's the distribution using the total OECD mass shooting rate of 0.049:
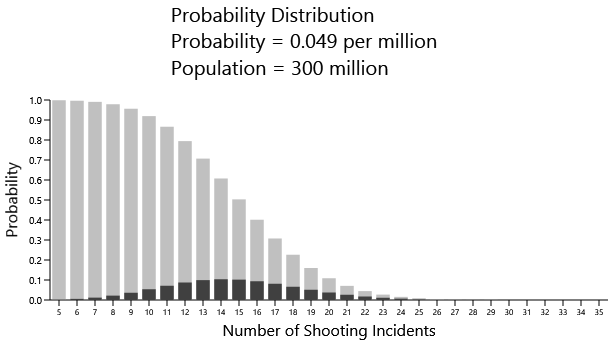
In reality the United States had 38 mass shootings. This graph is telling us that the likelihood of that happening is essentially zero.
Again, the problem is that we're using the overall OECD rate of 0.049. If we instead use the US rate of 0.121, then we see something quite different:
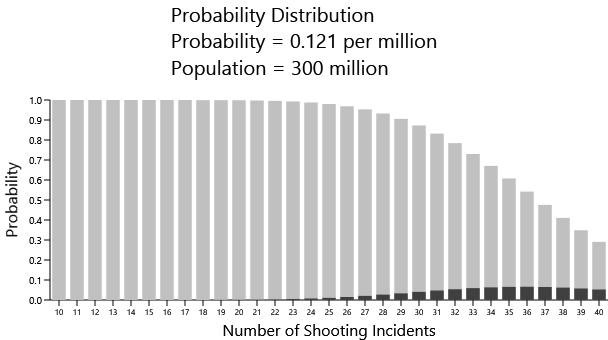
But this isn't telling us anything that we didn't already know — that the mass shooting rate in the United States is much higher than the other OECD countries.
At the other extreme, here is the distribution for countries with a population of 5,000,000 — the approximate population of the three countries at the top of the IJReview and RampageShooting rankings. This uses the rate chacteristic of the total OECD countries excluding the United States:
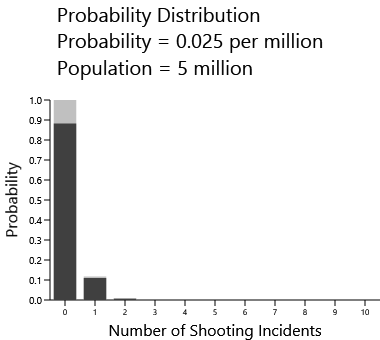
To be sure, it is expected that these countries will have no mass shootings, but there's a 10% probability that they will have at least one.
Conclusions
To get meaningful information from data concerning mass shootings, it is necessary to be aware of statistical fluctuations that result from an insufficient numbers of incidents. Once that is done, it becomes obvious that the rate of mass shootings in the United States is significantly higher than the other OECD countries.
Of course, this isn't an academic exercise. Nobody will be surprised to learn that there is political motivation behind these attempts to demonstrate that the United States doesn't have horrendous incidences of mass shootings and other gun crimes. If the United States has levels of gun violence comparable with the rest of the world, there is certainly no need for gun-safety legislation.
Our political arena is open enough to debate these issues. But the debate should not involve the abuse of statistics. If people are opposed to gun-safety legislation, they should own the consequences of that opposition rather than try to hide those consequences behind a bogus interpretation of statistics.
Actual lives are at stake.